SUPERCONDUCTIVITY
FRUSTRATION
HIGH PRESSURE NMR
ORBIAL
■ FRUSTRATION
■ Heptamer vs heavy fermion
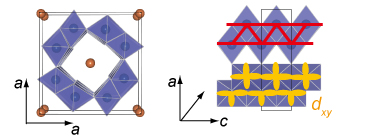
Pyrochlore lattice has the strongest frustration and hence can give quantum spin liquid as the ground state of antiferromagnetically-coupled localized spins. The macroscopic degeneracy of the ground state is highlighted in the diversity of magnetism.Spinel oxides having the V pyrochlore lattice are interesting in that the geometric frustration is imposed on the spin, charge, and orbital degrees of freedom. Especially interesting materials are AlV2O4 and LiV2O4. AlV2O4 has 3d2.5 electrons and insulating ground states. Our NMR measurements uncovered the unusual magnetic ground state with the nonmagnetic heptamer and magnetic triangular lattice, which have been proposed theoretically. In contrast, LiV2O4 having 3d2.5 electrons is metal with the effective mass 1000 times heavier than that of free electron. Many origins have been theoretically proposed; geometric frustration, orbital fluctuations, strong correlation, etc. To give microscopic insight, we have revealed the 3d orbital state from the anisotropy of magnetic hyperfine coupling.
■ Trimer vs tetramer
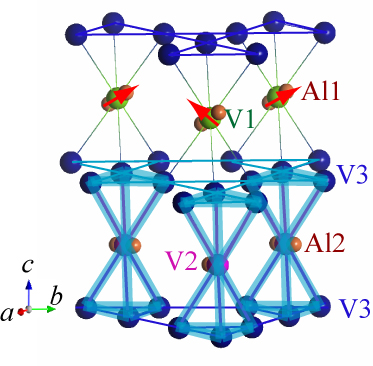
Triangular lattice is the typical example of two-dimensional frustrated lattice. In presence of orbital degrees of freedom, the ways of symmetry breaking can be diverse; nonmagnetic trimer and dimer, magnetic tetramer and trimer, etc. We revealed the local spin and orbital states in the bilayer triangular lattice system BaV10O15.■ Peierls vs Mott
Peierls transition and Mott transition are contrasting basic notions of metal-insulator transition. They are hardly distinguishable in the quasi-one-dimensional system with strong electron correlation, as discussed in VO2. In a V hollandite K2V8O16 having zigzag ladders, these two features are competes with each other owing to the geometric frustration, which is evidenced from the coexistence of nonmagnetic and paramagnetic V sites observed by 51V NMR at ambient pressure and under pressure. The pressure-temperature phase diagram based on 1/T1 and 1/T2 measurements suggests that the transition is Mott like at low pressures and becomes more Peierls like at high pressure.